About
RadialNet is a network visualization tool developed for Umit during the Google Summer of Code 2007. In Umit it's called UmitMapper. It consists in a graphical tool to illustrate the Nmap network mapping.
Features
- Visualization of network topology with Nmap XML as input.
- Interactive exploration of network through visualization.
- Complete viewer of mapped services and NSE output.
- Complete viewer for OS fingerprint output.
- Complete viewer of traceroute information.
- (in progress) Report of vulnerabilities for each host in network.
- (in progress) A local vulnerabilities database search engine.
- (in progress) A local Nmap OS fingerprint database visualization.
Installing
The following explains how install the RadialNet tool.
Requirements
To install RadialNet you have to satisfy the following dependencies:
- Python: http://www.python.org/.
- PyCairo: http://cairographics.org/pycairo/.
- PyGTK and PyGObject: http://www.pygtk.org/.
RadialNet works under Unix, Windows and Mac OS X operating systems.
Download
Get the latest version at GitHub repository.
Using
To start the RadialNet application you can execute this command:
$ python radialnet.py
You can open an Nmap XML file as argument of -f option or just open it through the GUI. There is a Nmap XML example in folder share/sample.
If everything is correct, you'll see something like images in the screenshots section.
Visualization
The visualization can show so much information. Sometimes it is needed to hide some of these information to keep the visualization clean.
Colors and sizes
The color and sizes of network nodes were chosen to indicate the severity of their problems. Right now, the colors are mapped according to the number of ports on a particular node. Soon, the retrieved information with Nmap will be matched with the NVD database to create a much better security report.
If the Nmap XML file doesn't have information about the services in a node, this node will be filled with white and have a small size. Also, to represent a starting point a black node is used (hostname is the localhost and its ip is 127.0.0.1). In addition, if the traceroute information of a node is not available, the node is linked to localhost with a blank dashed edge.
Shape
We use squares to easily distinguish devices like routers, switches and wireless access points from general purpose hosts.
Icons and pop-up windows
Icons are used to display some useful information about hosts. Bellow you can see a table showing each icon and its description.
| Icon | Description |
|---|---|
| the host has filtered ports. | |
| the host is a firewall. | |
| the host is a router. | |
| the host is a switch. | |
| the host is a wireless access point. |
The pop-up windows can be displayed by right-clicking on the node. They show node's information like scanned ports, operating system, traceroute, etc. As soon as possible, new features like security reports will be added.
Interaction
Interaction is a strong feature of RadialNet.
Animation
You can change the center of visualization by clicking on a node. You can change the method of interpolation between polar or cartesian. The first method minimizes overlapping in the animation, but the second is cleaner for some people. If the animation is to slow you can decrease the number of frames on the top right-hand side of the control panel. You can also change the coordinate system being used to do the interpolation (polar or cartesian).
Node's placement
Two options for a node's placement can be used, Symmetric and Weighted. The first method is easier to view because it better shows the network hierarchy, but the second uses available space much better.
Grouping
You can group nodes selecting the 'Group node' option on the top toolbar. The children (only blue line connections) of a node are grouped with it.
Fisheye
Sometimes you may wish to focus some regions of the map. To make this possible a fisheye mechanism was implemented.
Screenshots
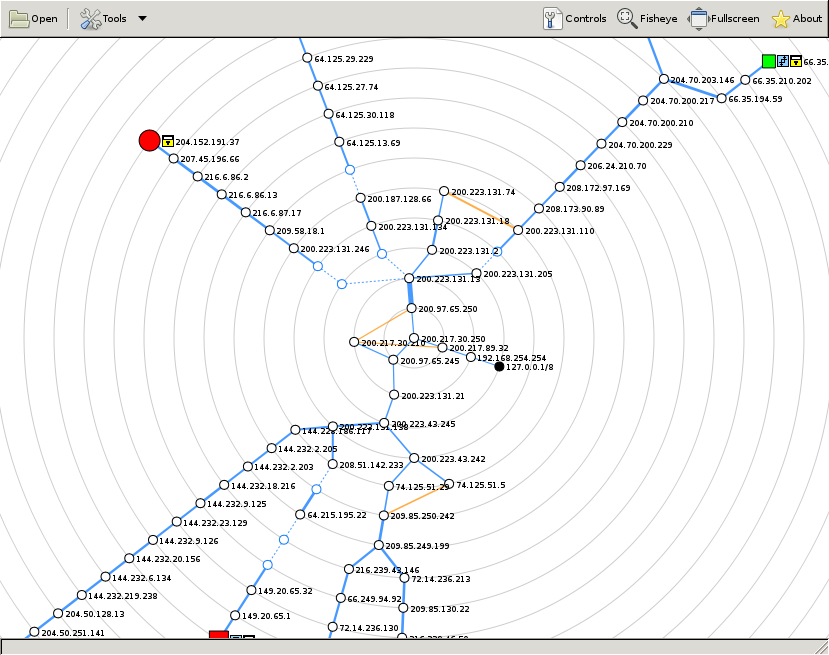


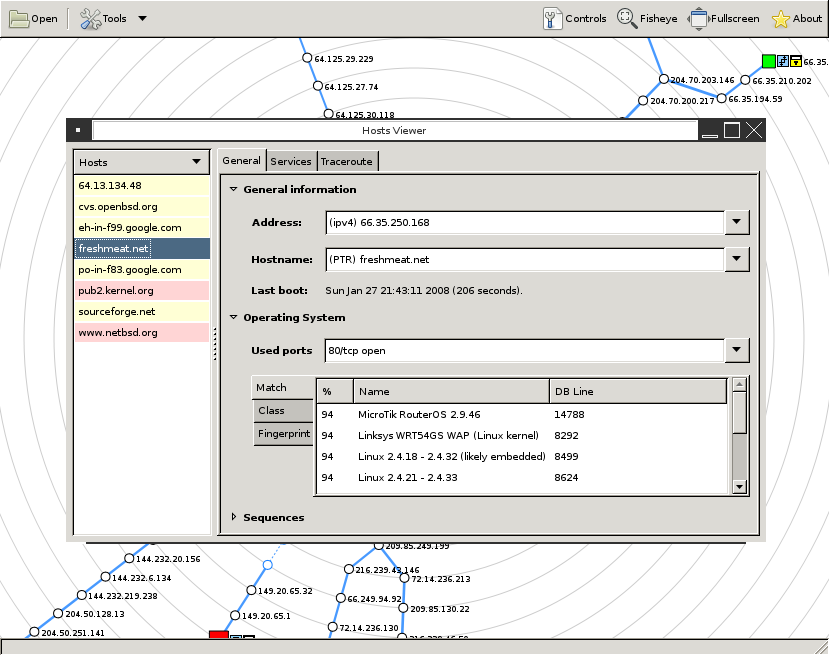
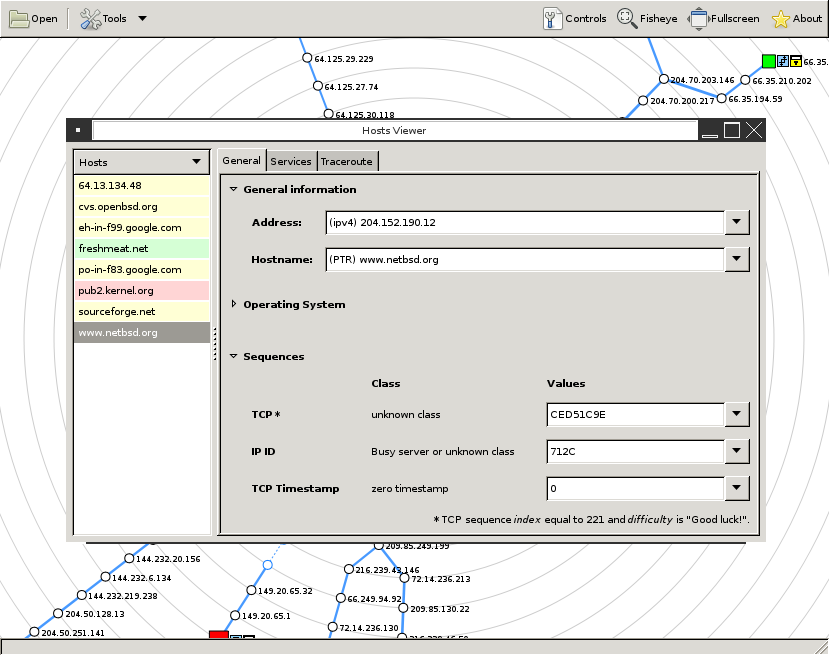

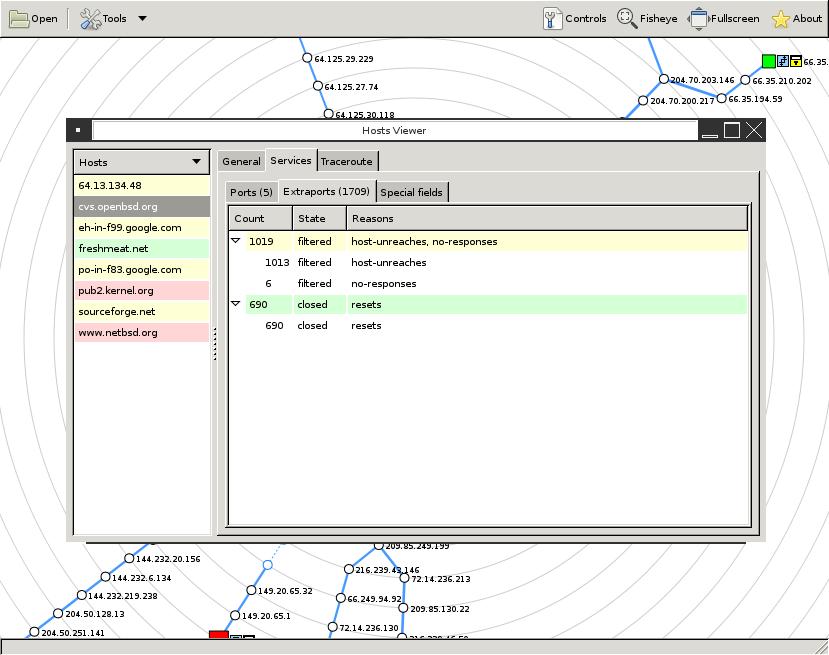
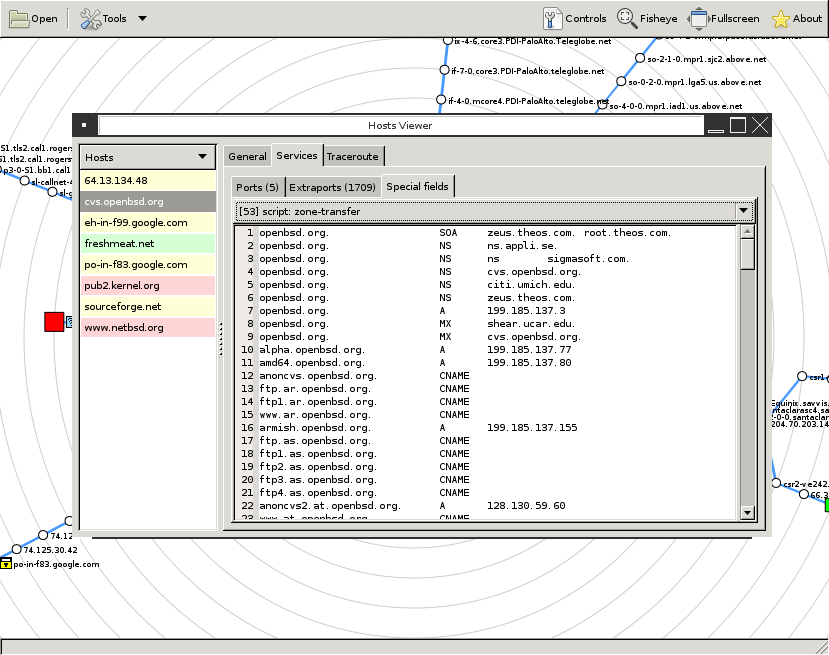
 Screenshots above are based on RadialNet 0.4.
View  source
file index.t2t.
source
file index.t2t.